[ad_1]
Hi friends,
Today we’re excited to announce the public preview of Microsoft Graph Activity Logs. Have you wondered what applications are doing with the access you’ve granted them? Have you discovered a compromised user and hoped to find out what operations they have performed? If so, you can now gain full visibility into all HTTP requests accessing your tenant’s resources through the Microsoft Graph API.
*Note: We’re enabling the feature starting today. Public preview will be available in all public cloud regions within two weeks.
You’re currently able to collect SignIn logs to analyze authentication activity and Audit logs to see changes to important resources. With Microsoft Graph Activity Logs, you can now investigate the complete picture of activity in your tenant – from token request in SignIn logs, to API request activity (reads, writes, and deletes) in Microsoft Graph Activity Logs, to ultimate resource changes in Audit logs.
The Microsoft Graph Activity Logs include information about the request and client application. Some common use cases include:
- Identifying the activities that a compromised user account conducted in your tenant.
- Building detections and behavioral analysis to identify suspicious or anomalous use of Microsoft Graph APIs – such as an application enumerating all users; or making probing requests with many 403 errors.
- Investigating unexpected or unnecessarily privileged assignments of application permissions.
- Identifying problematic or unexpected behaviors for client applications – such as extreme call volumes that exhaust rate-limits for the tenant.
To illustrate working with these logs, we can look at some basic LogAnalytics queries:
Summarize applications and principals that have made requests to change or delete groups in the past day:
|
MicrosoftGraphActivityLogs | where TimeGenerated > ago(1d) | where RequestUri contains ‘/group’ | where RequestMethod != “GET” | summarize UriCount=dcount(RequestUri) by AppId, UserId, ServicePrincipalId, ResponseStatusCode |
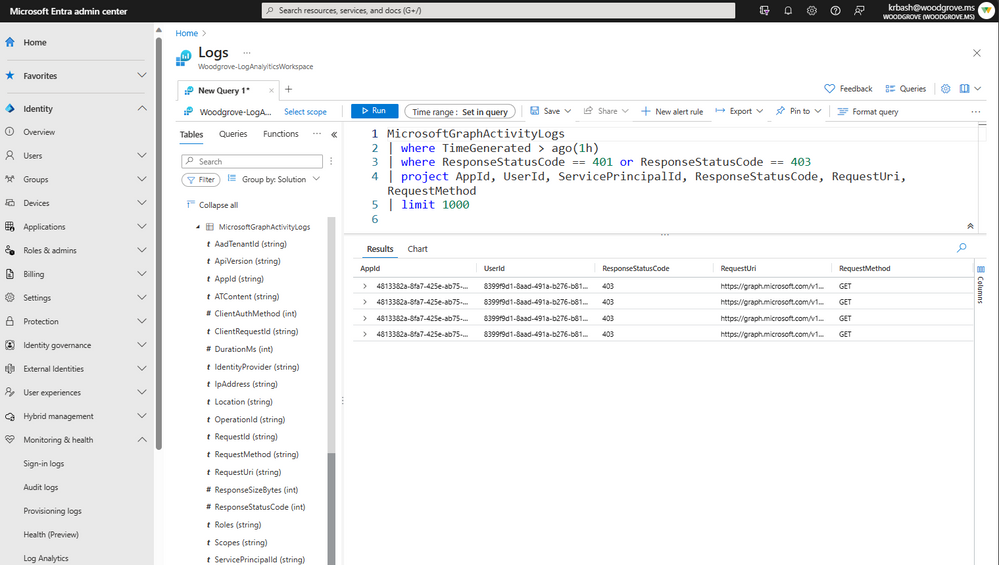
To see recent requests that failed due to authorization:
|
MicrosoftGraphActivityLogs | where TimeGenerated > ago(1h) | where ResponseStatusCode == 401 or ResponseStatusCode == 403 | project AppId, UserId, ServicePrincipalId, ResponseStatusCode, RequestUri, RequestMethod | limit 1000 |
Get top 20 app instances by request count:
|
MicrosoftGraphActivityLogs | where TimeGenerated > ago(1d) | summarize RequestCount=count() by AppId, IpAddress, UserAgent | sort by RequestCount | limit 20 |
Microsoft Graph Activity Logs are available through the Azure Monitor Logs integration of Entra. Administrators can configure the collection and storage destinations of Microsoft Graph Activity Logs through Diagnostic Setting in the Entra Portal. These settings allow you to configure the collection of the logs to a storage destination of your choice. The logs can be stored and queried in an Azure Log Analytics Workspace, archived in Azure Storage Accounts, or exported to other SIEM tools through Azure Event Hubs.
For logs collected to a Log Analytics Workspace, you can use the full set of Azure Monitor Logs features, such as a portal query experience, alerting, saved queries, and workbooks.
Find out about how to enable Microsoft Graph Activity Logs, sample queries, estimated costs, and more in our documentation.
Learn more about Microsoft Entra:
[ad_2]
Source link


