[ad_1]
With the release of Real-Time Call Quality Analytics (RTA) to public preview September 30th, Microsoft Teams is now able to provide real-time call quality statistics for scheduled meetings in a centralized administrative console, something that has never previously been available in prior iterations of Microsoft meeting platforms.
Situations can arise where immediate analysis of a scheduled meeting is required and waiting until it has concluded is not an option. The Real Time Call Quality Analytics dashboard is able to provide administrators and support teams the following information when immediate (real-time) assistance is required.
- Meeting Participants
- Join & Leave Time
- User & Device Information (Name*, IP Address, Regional Location, Device, OS)
- Devices Including
- Microsoft Teams Room (Surface Hub, Teams Display, Collaboration Bar)
- Microsoft Teams IP Phones
- Connectivity Type (Wired, WiFi, WWAN)
- Changes in connectivity type (Wired to WiFi or WiFi to WWAN)
- Changes in IP addresses pertaining to connectivity change
- Network Metrics (Jitter, Packet Loss, Round Trip Time)
- Audio, Video and Application Sharing (Bitrate, Frame Rate)
- Devices Including
*Available only for internal users
Several of my customers in the financial services industry have been able to leverage the RTA dashboard to identify and assist with meetings that were experiencing “issues”. While active conferences, the support teams were able to identify specific users experiencing either packet loss or latency that exceeded tolerable thresholds. Once they knew which users were causing or experiencing the poor quality, they were able to chat with those users over Teams to run through remediation activities real time.
Customer quotes:
- “This is a HUGE improvement and very useful, nice work!”
- “Real-time telemetry is something we’ve been eagerly awaiting in Teams. It’s a leap forward in being able to support our users when they are experiencing issues.”
“My team has been anxiously waiting for Real-Time Analytics for years and now we’re honored to have played even a small role in making it a reality! The ability to monitor key calls as they happen has already helped us diagnose and resolve home network issues that were creating a poor experience for some of our priority users. RTA has been amazing at pinpointing the tricky problems when you know someone is having repeated issues but their experience may not be adequately captured in the averages and aggregates available after the call is over. I’m excited for what’s in the pipeline since it’s currently only scratching the surface of the value RTA could bring to the IT Pro!” – @Jonathan Clare, M365 Admin for Microsoft also accountable for Microsoft Teams meetings quality.
RTA is available for public consumption through the end of 2021. If you haven’t checked it out yet or used it for diagnosing a problematic conference, you should!
Using the RTA Dashboard
No additional steps need to be taken at the tenant level to enable the RTA feature. That said, any account that will be accessing the RTA dashboard will need to be a member of at least one of the following RBAC roles.
- M365 Global Admin
- M365 Global Reader
- Teams Administrator
- Teams Communications Support Specialist
- Teams Communications Support Engineer
With the proper permissions allocated to the support teams, where do we go from here? To the Teams Admin Center (TAC) of course!
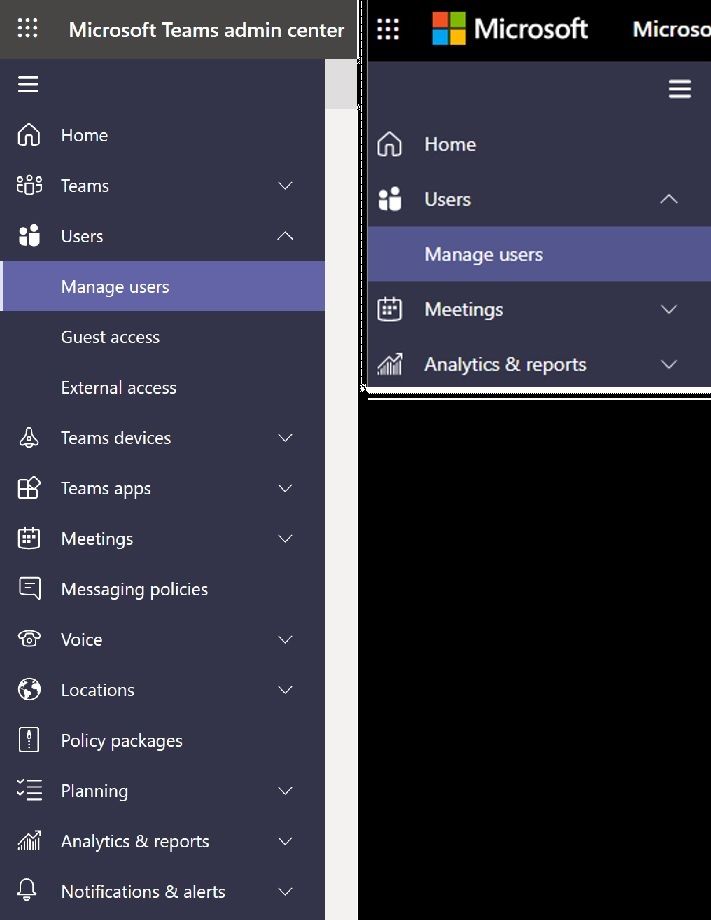
Once logged into the TAC, browse to the Users -> Manage Users section.

Menu options will vary based on the permissions assigned to your account. Two different views are shown above, the left with Global Administrator, the right with a more restrictive role.
Select the user or search for them in the search bar then select the account.

Navigate to the Meetings & Calls section. All meetings from the past 24 hours will be displayed here, including meetings that are in-progress.

From here there, either the Meeting ID can be selected to show metrics for the user currently selected, or the participants can be selected to show high level call telemetry for all parties in the call.
If the problematic user is known, navigating to that users’ view makes sense. Otherwise, some analysis may be required to find the problematic party.
Participants View
When selecting the participants, we are presented with the following information:
- Meeting Participants that reside in the tenant
- Join and Leave Times
- Participation Duration
- IP address
- Regional Location
- Network Type
- Connection Type
In the example below, the details outlined in orange show the user has joined the meeting from multiple devices as indicated by the secondary line underneath the name and picture. We can see that the endpoints for this user have disparate IP addresses indicating they are connected to different networks as well. The second user listed also appears to have been joined with multiple devices, though we can see one left the meeting before the other participants.

If users are experiencing high levels of packet loss, it will be shown on this page. This piece of information can be used as a starting point to troubleshoot a meeting when minimal background was provided. The image below shows a user outlined in red that will later be referred to in the User view. The User view can be entered from this page by clicking on the Join Time for the user in question, instead of having to go through the search method.

User View
In the user view we can see Audio (Inbound & Outbound), Application Sharing (Inbound & Outbound), and Outbound Video telemetry for the selected account over the duration the user was in the conference.
Data is collected and displayed for each active modality in the conference as a dot on the respective line graph every 10 seconds. Each data point can be hovered over to provide numeric values for the metric being displayed along with a time stamp.

By default, the graphs will display the last 2 minutes of the conference, whether active or ended. The time period displayed in the graph can be adjusted by using the sliders, outlined in green, below the graph. Video and Application Sharing follow the same layout for their sliders.
Once the problematic period is identified, focus in on 2-3 minutes around the event.

Note: The full meeting duration will be available once the conference has ended. While a conference is active, only the past 20 minutes are available to maneuver through. Conferences exceeding three hours will only have the last three hours available for review in RTA once the conference concludes.
On the inbound stream we are presented with Jitter and packet loss telemetry. The outbound stream presents Round Trip Time and Bitrate. In this conference, we can see that Siunie experienced some inbound packet loss, which is automatically shown as a red line where tolerable thresholds are exceeded.

If we navigate to the person previously identified as experiencing Packet Loss in the Participant view, we can see additional details related to the event. When hovering over the event in question below, we can see that there was a change in IP address and Location. A change in networks will typically cause some level of temporary degradation. This level of Packet Loss can typically be associated with loss of, or a choppy experience for the modality experiencing issues. In this case it wouldn’t be surprising to hear the user state there was an audio issue.

All metrics available for each modality are displayed by default for each graph, though individual metrics can be hidden by clicking on them in legend below each chart. For example, if only Jitter is a concern click on Packet Loss so that only Jitter is displayed.


We are also able to see when a user switches networks while on a call as indicated by the yellow triangle on the timeline. It is expected that users will experience a “blip” or quick reconnect while the network switch occurs.


The image below shows a user that was repeatedly switching between WiFi and WWAN connections. Significant Packet Loss occurred right after the switch, which would have caused audio issues while in the call. We can see an Android device was used to participate in the meeting, so we can make an educated guess that this person was likely “on the go” during the network switching events.

When reviewing video streams, only the Outbound stream details will be displayed. This is expected as Teams inbound video is not a single stream. Network events will be displayed in this chart similar to the other modalities though.

Application Sharing will show inbound or outbound metrics depending on whether the person is receiving the share or is the presenter. This should be the go-to spot when screen sharing is not performing as expected. The images below show what the metrics look like for a viewer and presenter. There can only be one presenter at any given time, so only one of the Application Sharing charts will be displaying data points based whether that user is sharing or viewing.
Viewer

Presenter

What’s Next
Now that RTA has been released to commercial tenants, we have the following enhancements on the roadmap for tentative release in H1 2022.
- Government clouds: GCC, GCC-High and DOD Tenants
- 3-Day data retention, expanding on the current 24 hours
- Platform & Scenarios
- Support for Web Clients (Chrome and Edge)
- Wifi network band and signal strength
- Additional Telemetry
- Capture and Render Device Info and Mid-call changes
- Battery, CPU Usage & Frequency
- Server Reflexive IP
- Protocol (TCP vs. UDP) for each stream
- Meeting reliability – Join Failures, mid-call failures
- RTA based on Role Type (Presenter/Attendee)
- Streaming Attendee Analytics
- Dashboard Improvements
- Sorting, Filtering, Searching, Exporting
- Real-time monitoring and alerting
- Aggregated multi-user grouping and data support
- More information in the Participants view
- Real-time alerts for defined users experiencing quality issues (Exec or C-Level)
(*) Thank you Jim Coan, the co-author of this article. This is the fruit of our collaboration
Source link